A transparent film
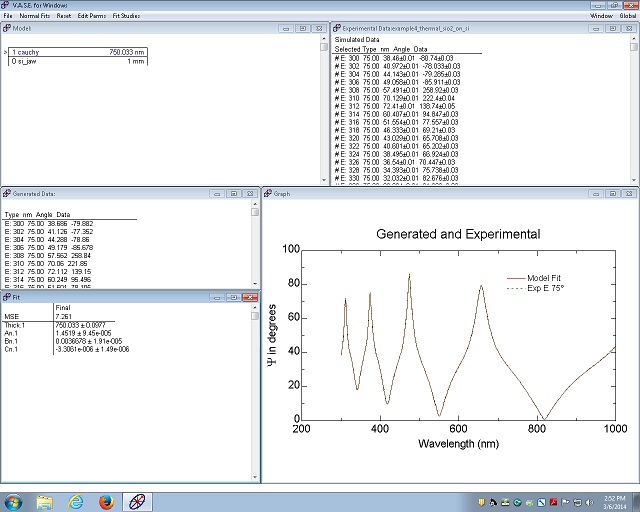
- Assume that SiO2 on Si wafer was measured, and Cauchy model fitting was done.
1. Load General Oscillator layer window
1. The fitting thickness was 750.003 nm, and MSE was 7.261.
2. Right-click on the cauchy layer in the Model window to open the following menu.
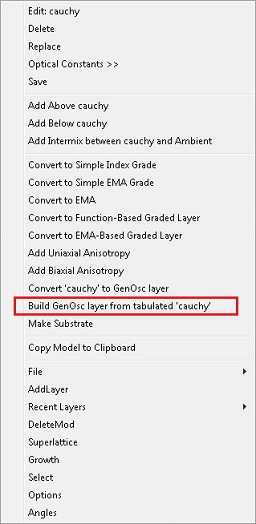
3. Choose "Build GenOsc layer from tabulated "cauchy".
4. The following dialog box appears.

5. Click "No".
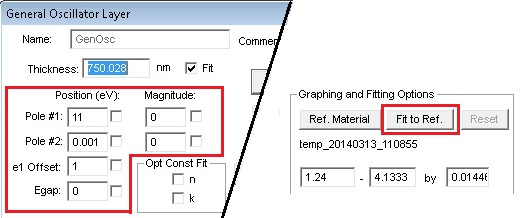
6. General Oscillator layer window appears.
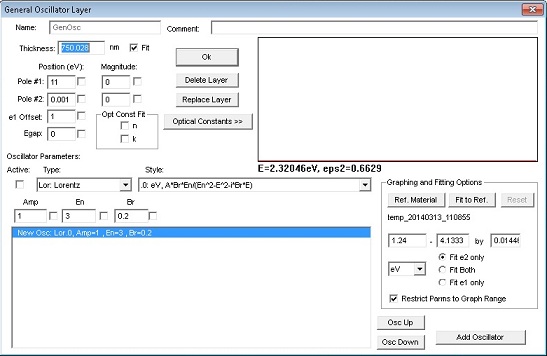
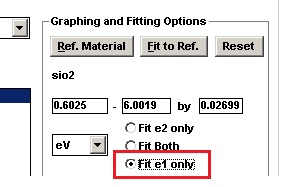
2. Fit e1
1. Select "Fit e1 only" in Graphing and Fitting Options box.
2. Check fit boxes of the parameters that you want to fit.
- If you want to fix the thickness, then remove the checking from the fit box of Thickness.
- The result of fixing the thickness is also shown below.
- Warning: Do not touch n and k in the "Opt Const Fit" boxes.
- Tip:
- Note shape of the green e1 curve:
- Pole #1: Dispersion upturn at high-eV.
- Pole #2: Small Dispersion downturn at low eV.
- Check e1 offset first, and click the "Fit to Ref" button. See if the black fitting curve is fitted with the e1 green curve.
- If the fitting is not good, check the fit boxes of Pole#1 Position(eV) and/or Magnitude.
- Click the "Fit to Ref" button. See if the black fitting curve is fitted with the green curve.
- If necessary, check the fit box of Pole#2 Magnitude. Normally, do not touch Pole#2 Position (eV).
- Click the "Fit to Ref" button. See if the black fitting curve is fitted with the green curve.
- General guide line
- Do not fit Position of pole if Amplitude = 0.
- Do not fit Position of Pole#2.
- Pole#1 and e1-offset often correlated
- Both increase index, but Pole#1 Amplitude also adds curvature (dispersion).
- Often possible to fix either pole 1 position or pole 1 magnitude.
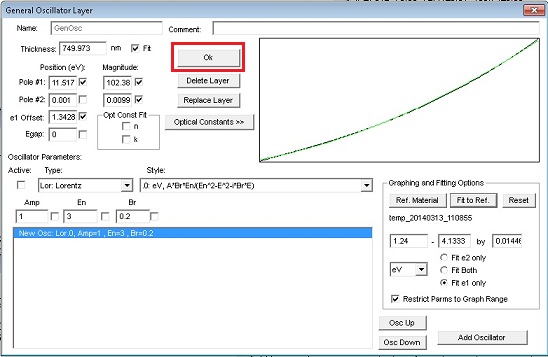
3. If the fitting is acceptable, then click "OK".
3. Normal Fit
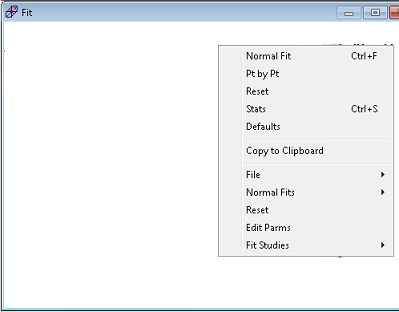
1. Right-click on the Fit window to pop-up the menu.
2. Click the "Normal Fit".
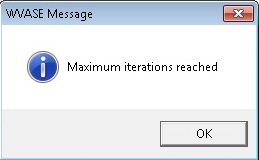
3. When the fitting is done, Message box shows up. Click "OK".
- Since this message is "Maximum iterations reached", the MSE might not be the minimum. So, you can do "Normal Fit", again.
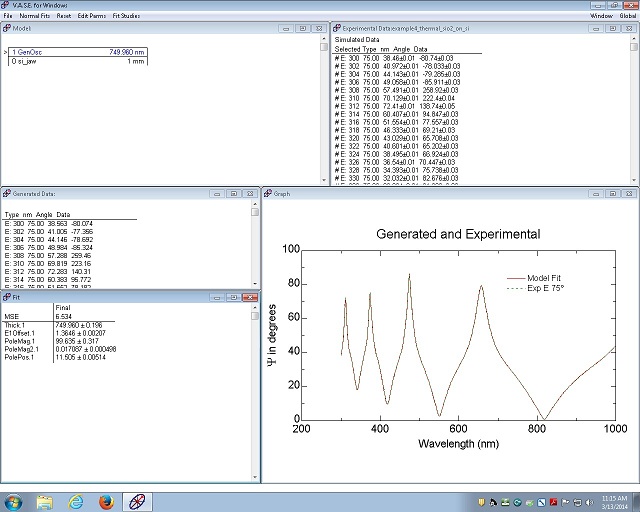
4. The fitting result is shown in the Fit window.
- The fitting thickness is 749.96 nm, and MSE is 6.534.
- If the checking of the thickness was removed from the fit box, and the thickness was fixed to be 750.003 nm, then MSE was 7.198.
- If you want to see the optical constant at a particular wavelength, click the "Optical Constants >>" button in the General Oscillator layer window.