Analyze Controls
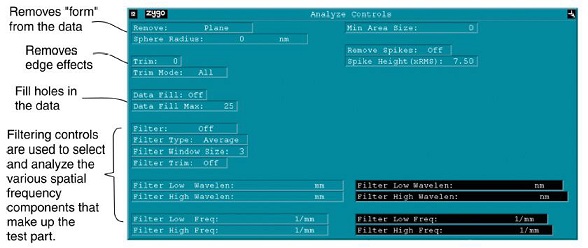
- These Control boxes are used to select data analysis parameters.
- Click the Analyze button to update results after changing these controls.

Contents
1 Removing Background Shape
1.1 *Remove*
1.2 Sphere Radius
2 Trimming Data
2.1 Trim
2.2 Trim Mode
3 Data Fill
4 Data Fill Max
5 Filtering Data
5.1 Filter
5.2 Filter Type
5.3 Filter Window Size
5.4 Filter Trim
5.5 Filter Low Wavelen
5.6 Filter High Wavelen
5.7 Filter Low Freq
5.8 Filter High Freq
6 Min Area Size
7 Remove Spike
8 Spike Height (xRMS)
1. Removing Background Shape
- Remove specifies the overall surface shape(s) to subtract from the data during analysis.
1.2 Sphere Radius
- Sphere Radius specifies the radius of the sphere to be removed.
- The sign convention is: a convex surface has a positive radius; a concave surface has a negative radius.
2. Trimming Data
- Trim specifies the number of pixel layers removed from edges and around isolated obscurations.
2.2 Trim Mode
- Trim Mode Selects how data is trimmed.
- The Trim Mode control is available in both control and data windows; the control works in union with the Trim control in the same window.
- Settings: All, Outside.
- All: trims pixel layers at the edges of all data including outside edges and edges around internal holes or obscurations.
- Outside: trims pixel layers at the outside edges only and not around internal holes. This is useful for removing diffraction edge effects without trimming holes in the data due to dropouts from poor modulation or nonfunctional camera pixels.
3. Data Fill
- Data Fill determines if missing data points in plots are filled, based on the setting of the Fill Max control.
- Settings: Off (default) or On.
4. Data Fill Max
- Data Fill Max specifies the maximum size in pixels of a data hole that is filled when the Data Fill control is On.
- It is the total number of pixels in any one data hole.
5. Filtering Data
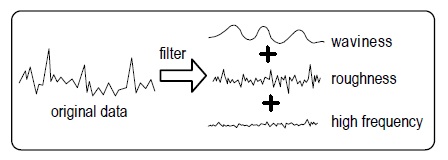
- By digital filtering of the test data, the surface characteristics of the test part are broken down into waviness, roughness, and high frequency results. Both map and profile data can be filtered.

- Use caution when filtering data, as it modifies the original data and can drastically alter the test results.
- To observe the effects of filtering, make the first measurement with the Filter control Off; then change the filter controls, press the Analyze button, and observe the outcome.
- For many applications, click the Analyze Cntrl icon to find the filter controls.
- The terms frequency and wavelength as they relate to filtering are shown here:

5.1 Filter
- Filter activates data filtering options.
- Settings: Off, Low Pass, High Pass, Band Pass, and Band Reject.
5.2 Filter Type
- Filter Type selects the filtering algorithm when the Filter control is active.
- Settings: Average, Median, 2 Sigma, FFT Auto, and FFT Fixed.
5.3 Filter Window Size
- Filter Window Size specifies the number of data points used to generate a new filtered data point when the Filter Type control is set to Average, Median or 2 Sigma.
- The larger the window size, the greater the filtering effect.
5.4 Filter Trim
- On: edge data is lost or trimmed due to filtering.
- Off: edge data is preserved.
5.5 Filter Low Wavelen
- Filter Low Wavelen specifies the lower cutoff for the filter either in wavelength or frequency when the Filter Type control is set to FFT Fixed and the applicable Filter is selected.
5.6 Filter High Wavelen
- Filter High Wavelen specifies the upper cutoff for the filter either in wavelength or frequency when the Filter Type control is set to FFT Fixed and the applicable Filter is selected.
5.7 Filter Low Freq
- Filter Low Freq specifies the lower cutoff for the filter either in wavelength or frequency when the Filter Type control is set to FFT Fixed and the applicable Filter is selected.
5.8 Filter High Freq
- Filter High Freq specifies the upper cutoff for the filter either in wavelength or frequency when the Filter Type control is set to FFT Fixed and the applicable Filter is selected
6. Min Area Size
- Minimum Area Size specifies the smallest acceptable number of contiguous data points in a valid region of data.
- Settings: 7 to 9999999, default is 20.
- Decrease to allow smaller areas.
- Increase to accept larger areas and reject smaller.
- It is useful for eliminating the effect of isolated data areas that are not meant to be included in the measurement, without the need of defining a mask.
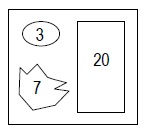
- In the example shown here there are three regions of data.

- A Min Area Size of 7 would exclude the data area consisting of 3 data points.
- By increasing the value, it could exclude other larger areas that modulate but are not of interest, because of their small size.
- Min Area Size is not the same as Min Mod Pts.
- Min Mod Pts specifies the minimum number of data points required for a valid data set.
- Min Area Size specifies the minimum size of a valid measurement area. (An area is an island of data separated by bad data.)
7. Remove Spike
- Remove Spike determines if spikes are removed from the data.
- On: A RMS is calculated for the entire surface and then each point is tested to determine if its height differs by at least that global amount from the average height of points in its averaging window. Spikes are only removed within the data window where the control is accessed.
- Off: Spikes are not removed.
8. Spike Height (xRMS)
- Spike Height is used to remove spurious spikes in the data.
- An indication of data spikes is a single color and an extremely flat oblique plot.
- The entry specifies a multiplier applied to the RMS whose resultant specifies a height above which all points are deleted.
- The Remove Spikes control must be set to On.
- RMS is calculated for the entire surface and then each point is tested to see whether its height differs by at least that global amount from the average height of the points in its averaging window.
- Or in other words, single data points higher than the spike height are removed.
